Complete View Manual Of Trace Profiling
1. Trace Filtering
According to Container name + pid, find the request url that you need to detect, and select a Profile record. After that, the main page of the system will display the basic information of this trace and all the worker thread analysis

2. Trace Basic Information
2.1 Trace ID:
Users should ensure that their applications have SkyWalking probes installed; otherwise, the system cannot capture Trace ID and thread analysis will be affected.
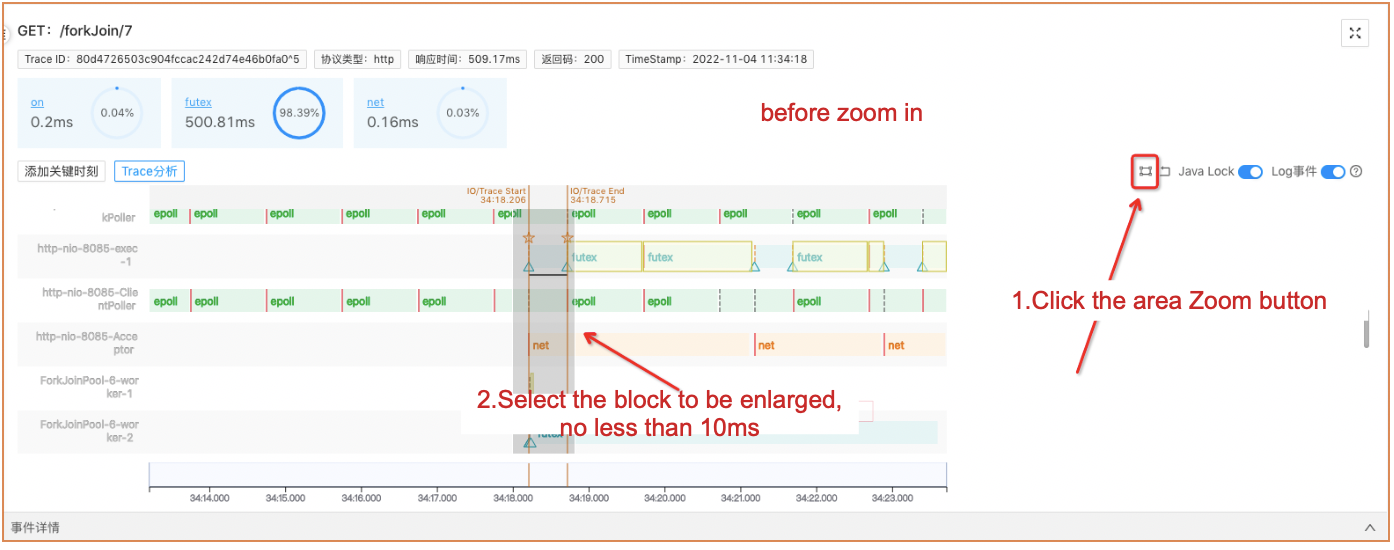
2.2 Response time analysis:
For the execution main thread of this Trace, the execution time proportion of each system call event is analyzed. When you clicking the time card, the corresponding event execution block on the thread axis will be highlighted, as shown in the figure below:
3. Thread Analysis
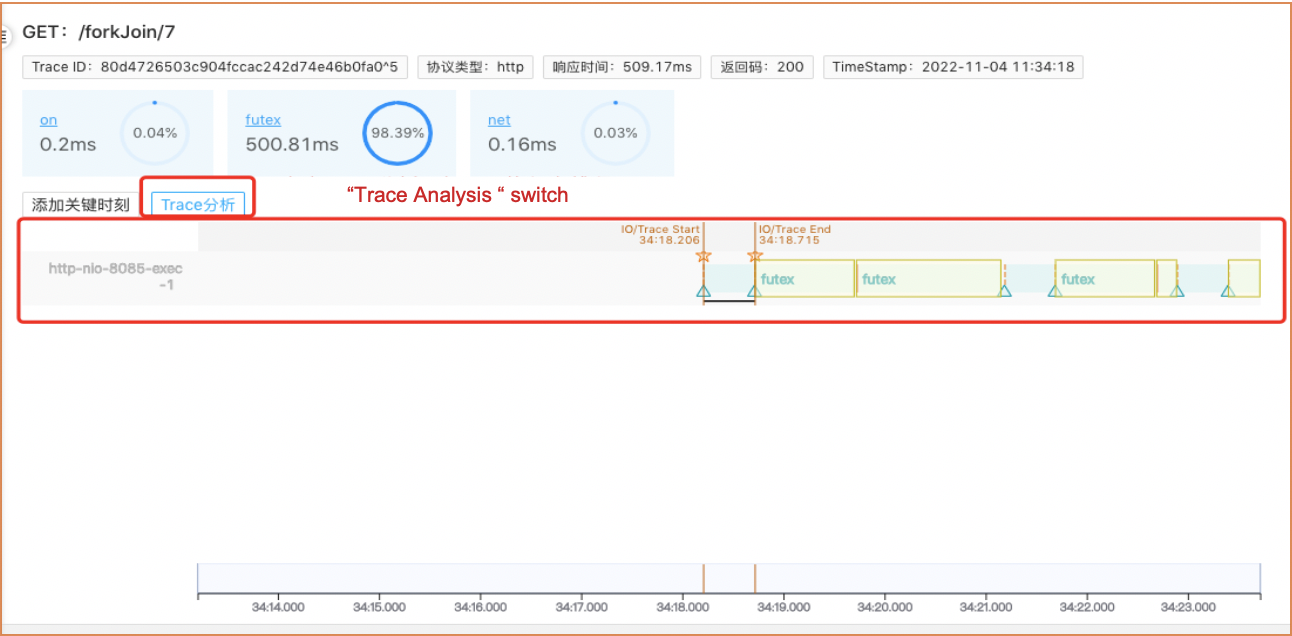
3.1 Trace Analysis
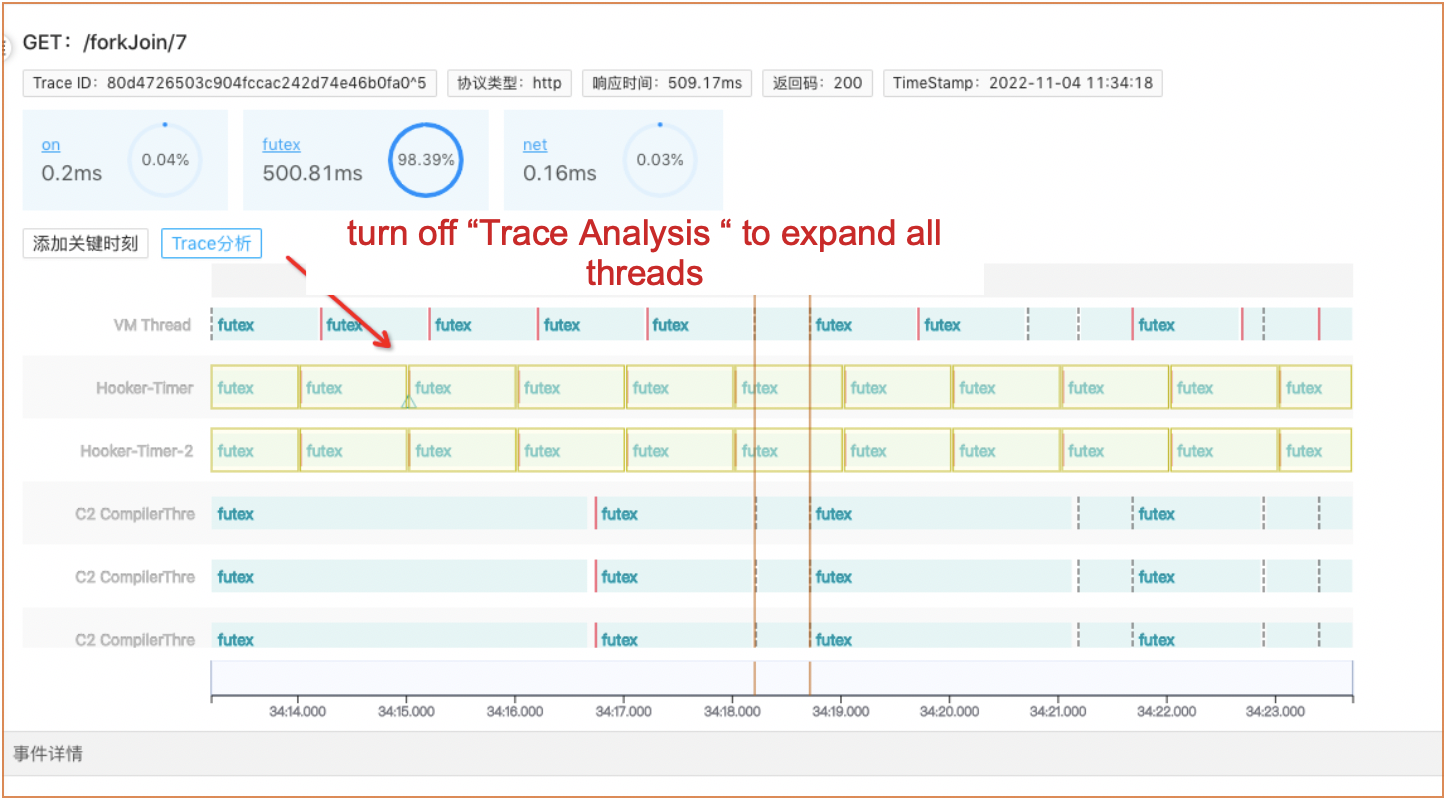
After selecting the Trace Profiling, the page will automatically turn on the “Trace analysis” switch for you and only show the main thread of this Trace execution. (Because there are too many threads, the key threads will be shown first. Click this button again and all threads will be expanded.)
3.2 Legend Description
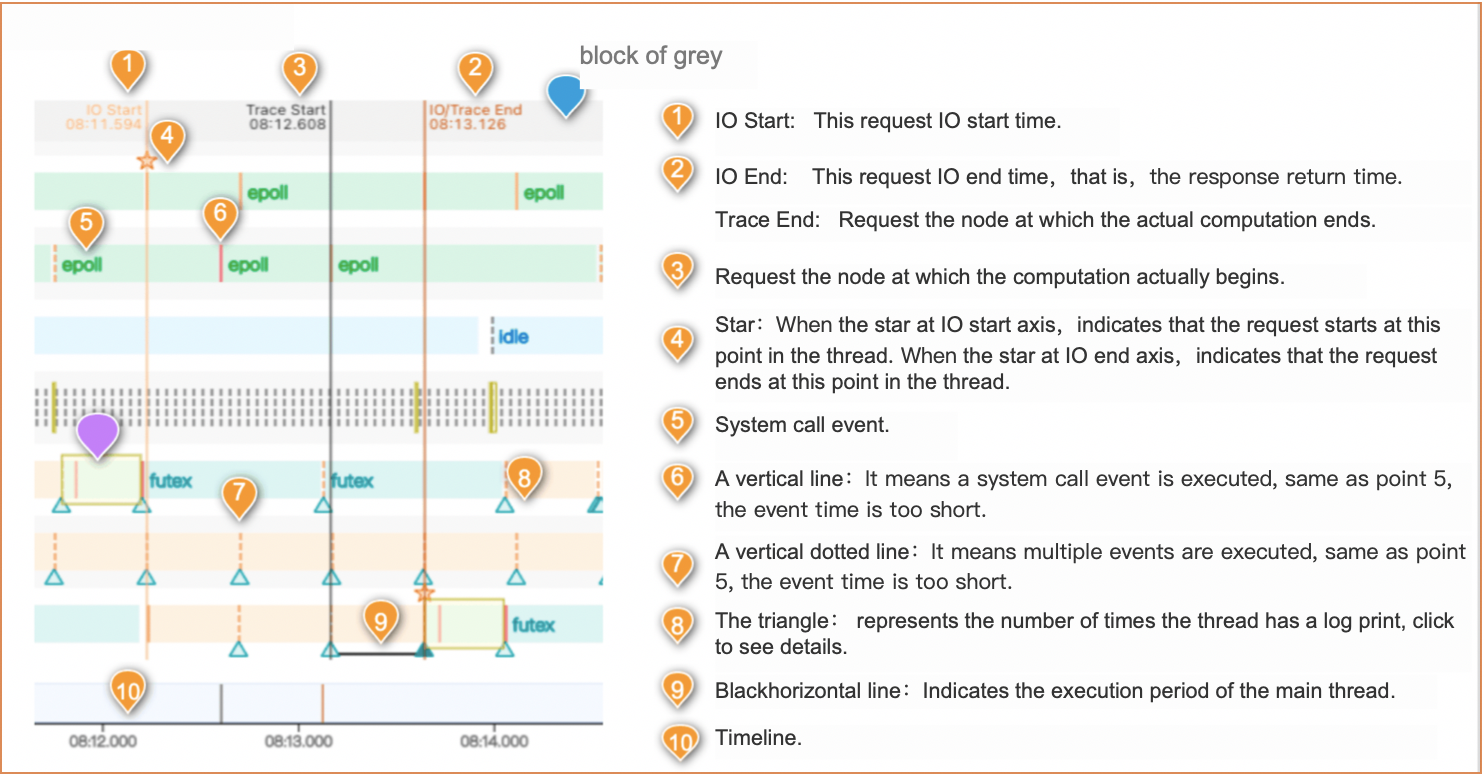
3.3 Thread System call event word description
futex: The thread is tamping, or waiting
on: CPU-on: indicates that the thread is performing CPU calculations
epoll: The thread is querying the read/write status of the system kernel file descriptor
net: The thread is making network calls, such as connecting to the database, calling the downstream interface, listening for network requests, and so on.
netread: Threads read network request flow
netwrite: The thread writes the return result stream of the network request
lock: The thread performs a lock operation
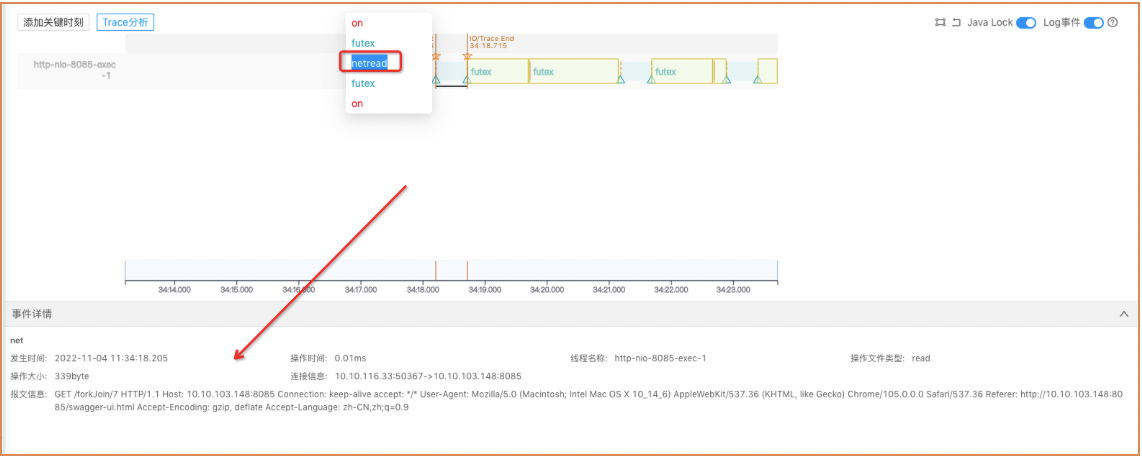
4. Event Detail
In this section, you can view detailed analysis of thread execution events, such as event occurrence, operation time, thread, type, and packet information. (Different events display different contents. For example, log events display log details. net events display connection information, request/response messages; cpu-on events show stack information and so on.)
5. Thread Axis Manipulation Tool
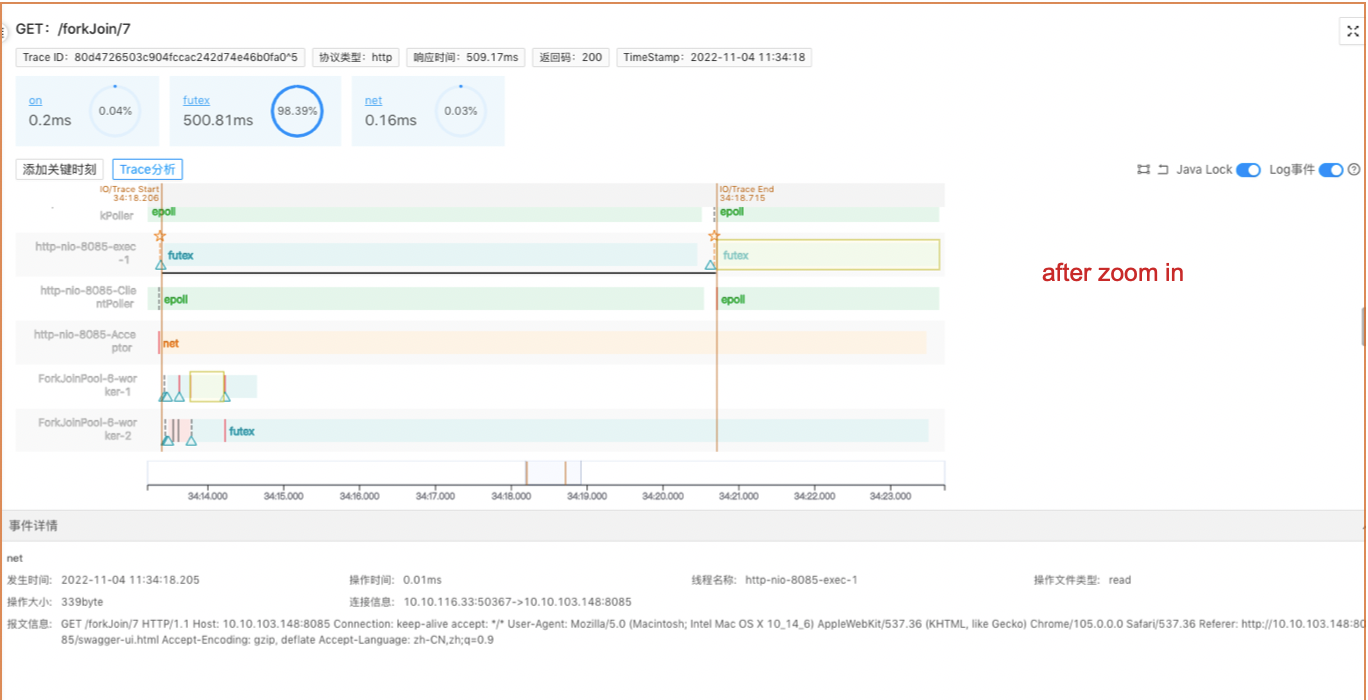
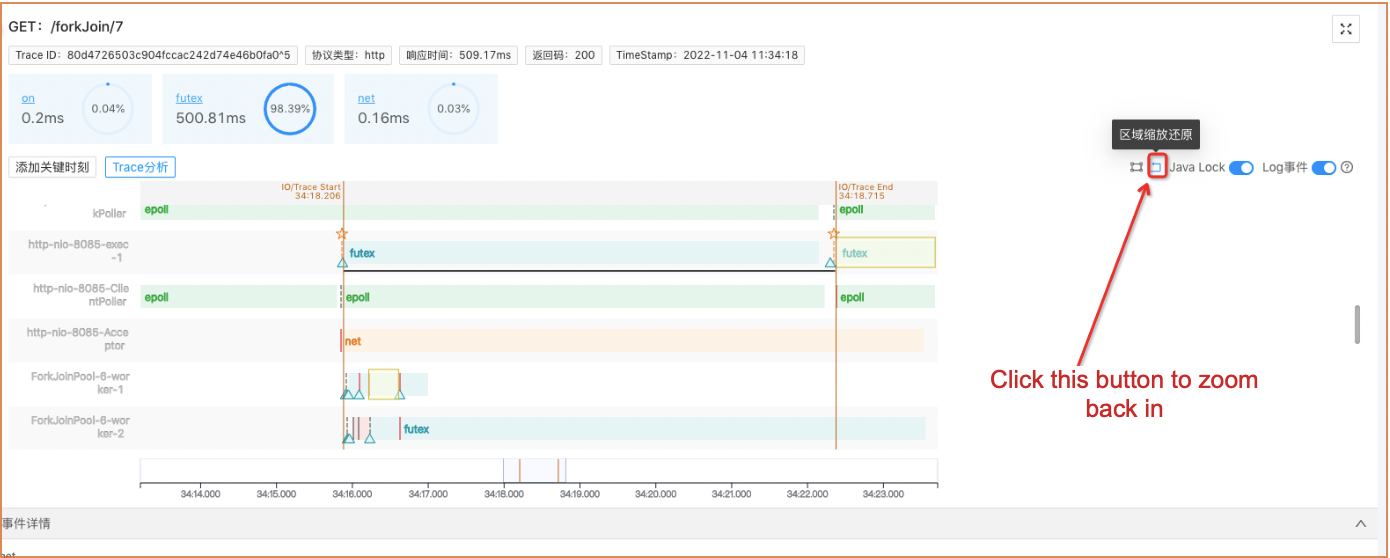
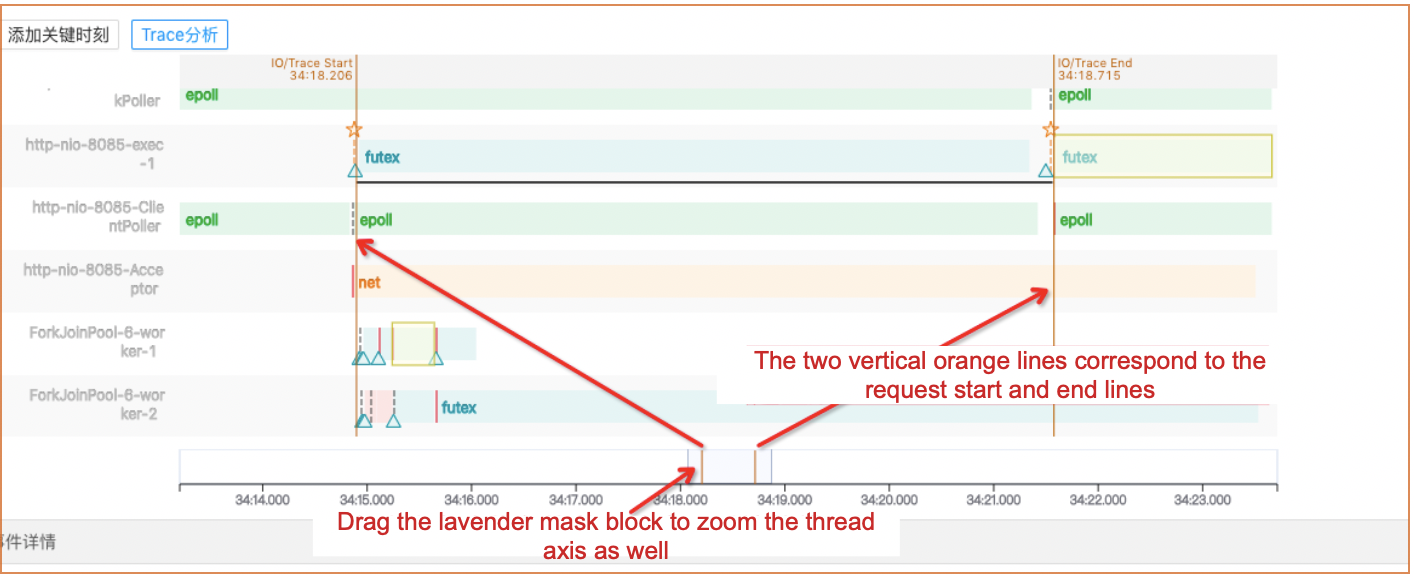
5.1 Scale of area
When some requests are executed too quickly, which is a short section on the thread axis, events pile up and cannot be seen clearly. This operation can be used to enlarge the thread execution process for easy analysis.
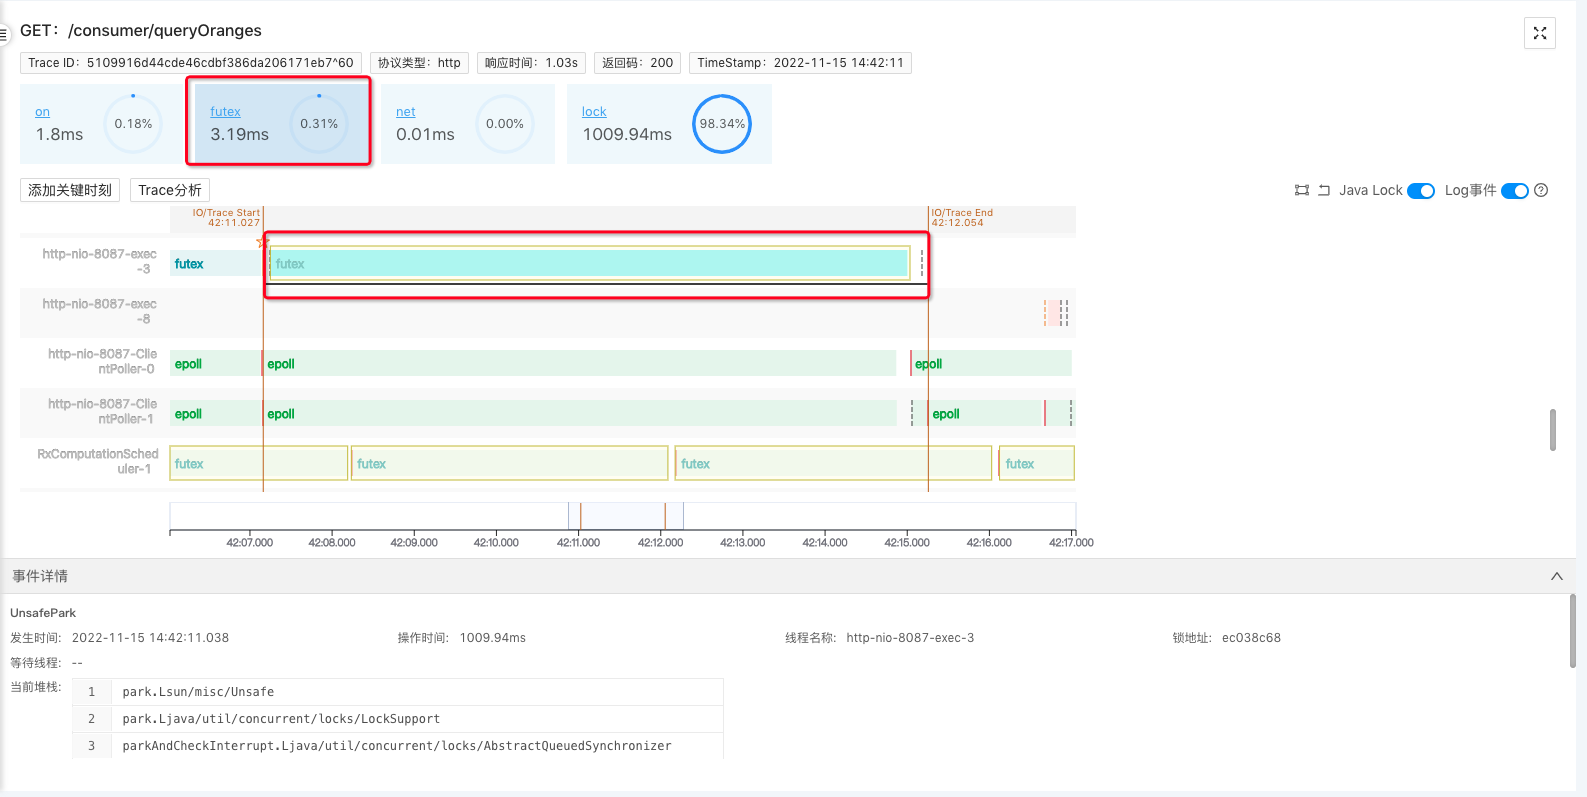
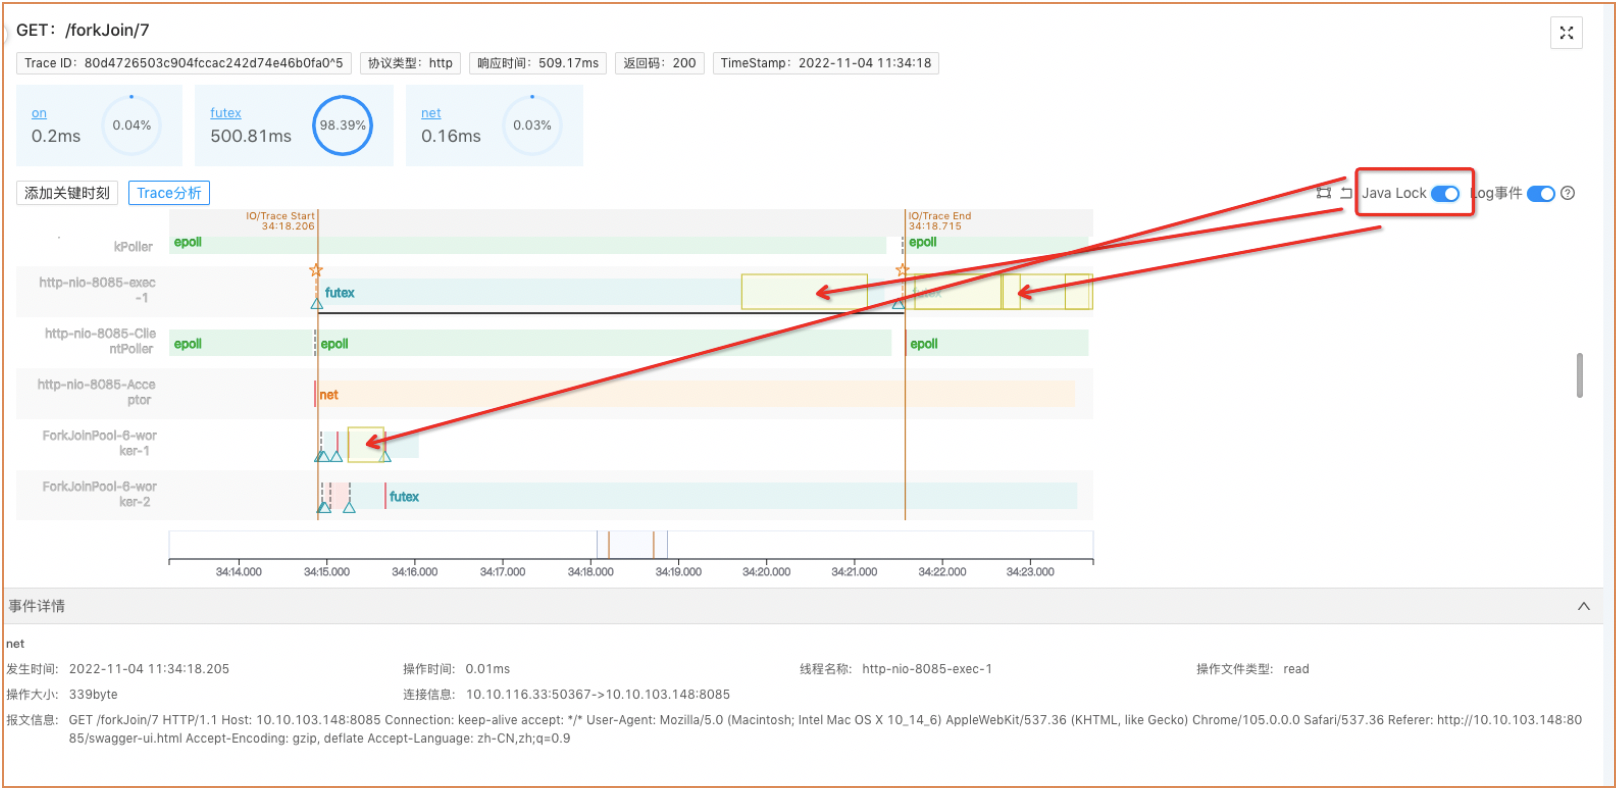
5.2 Java Lock
When enabled, futex events on the thread axis will be masked with a highlighted yellow block if they are java lock events, as shown below.
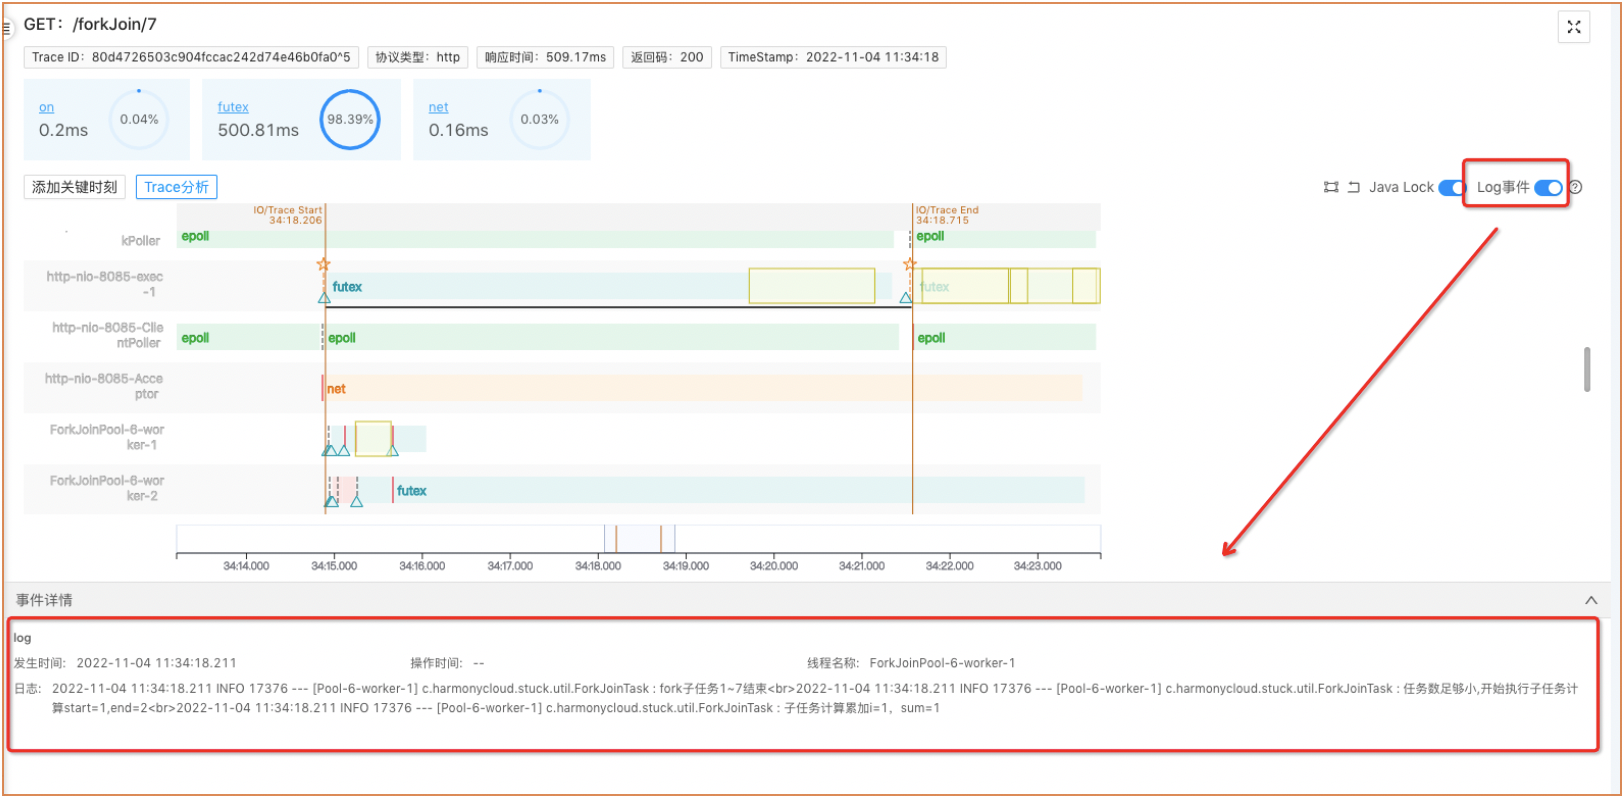
5.3 Log Event
After this function is enabled, all nodes that print logs will be displayed on the thread axis. The triangle in the figure below represents that. After clicking the triangle, you can view log information in the event details box
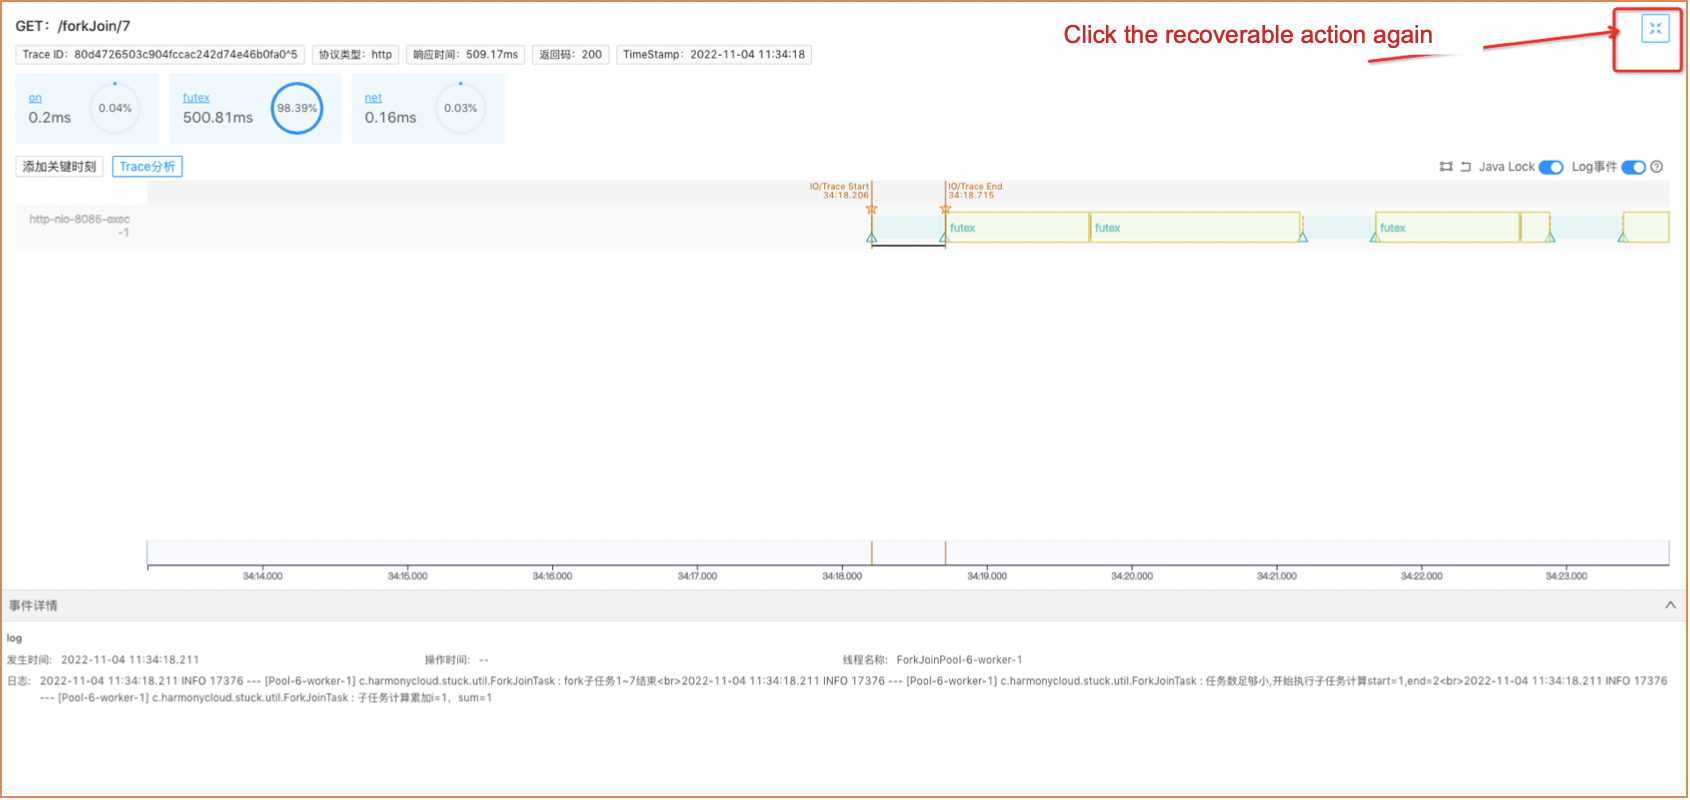
6. Page Zoom
After clicking, Trace analysis will be displayed in full screen on the page, and the upper and left menu bars will be closed, as shown below
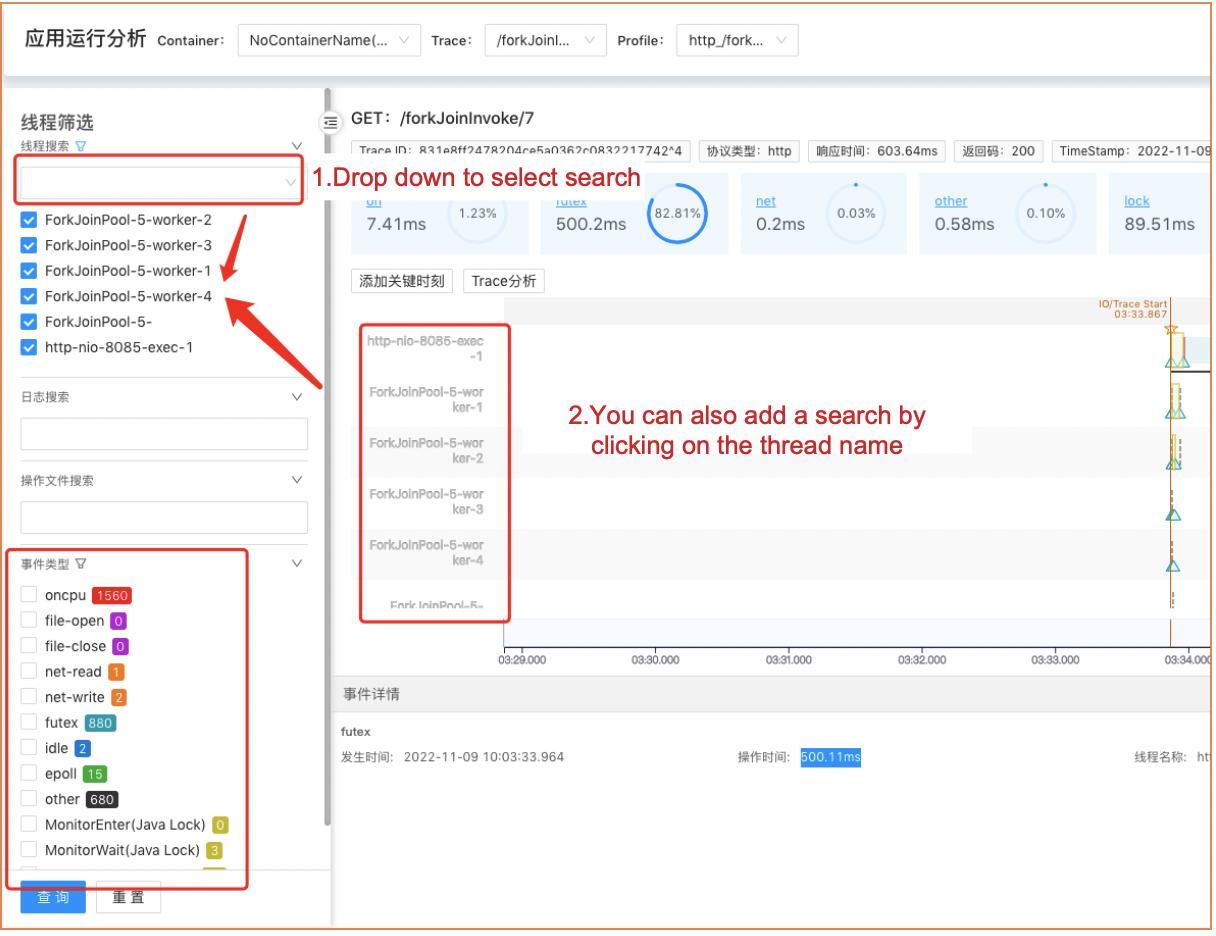
7. Thread Filtering
The current open source version supports searching threads by thread name, event type, or by clicking thread name on the thread axis to add a search.