RPC Trace
Distributed Tracing Definition
Google Dapper mentioned the way of distributed tracing for rpc call environment 10 years ago. And it is the foundation for the APM tool or Zipkin. Almost APM tool use the similar logic to do the distributed tracing. So it is popular concepts for micro-service environment, and everyone needs it.
RPC Trace Background
In China Bank System or Telecom System, the mission critical system used to be provided by its vendor which has been working for them for a long time. The vendor hates the APM tool, which instrument the code automatically for distributed tracing, because the vendor takes the responsibility for the stability of the mission critical system. They can’t take the risk at any chance, but the APM tool makes the code change in theory which has not been fully tested. So in China, even the world leading APM vendor can’t sell their product to many banks or telecom company.
In China, the banks and telecom company do need the distributed tracing, but their vendor hates APM. So for big company, they do the instrumentation manually and heavily rely on logs for distributed tracing. The big company invest a lot of money to instrument manually and make sure all the code has been tested. The interesting thing is the small companies they can’t pay such price to instrument all the apps manually and verified. They find a solution to work as a substitution for distributed tracing in their product environment which is not as complicated as the big company. The solution works well for them. The solution is analyzing all the network packets to get the service-map with rpc call latency only. We are inspired by their solution and wondering why it works? Finally, we figure out why, because for most cases, if there are some issue happen, the issue will affect all the rpc call between the two endpoint. So from service-map view, there will be a edge which represents from one pocess calling the other process shows the outages.
What is Kindling RPC Trace ?
Scenario: When a user access the apps, the apps code will ask the kernel to accept the incoming network request, and receive all the network bytes. After that the apps code will do some business logic, or calling other service, or ask the kernel to read some files or write some logs data to files. After finish the processing, the app code will ask the kernel to send the response back to the user by network.
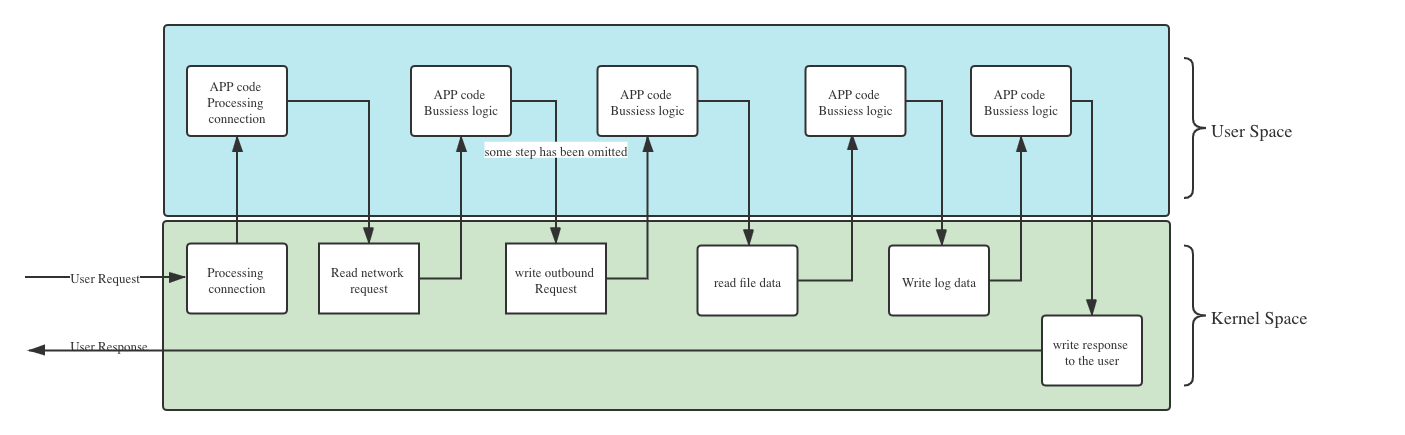
From the above statement, the app code will work with the kernel together to process user request, but the kernel side is consider as static and stable in traditional environment. In the Cloud native environment, all the infrastructure layer is heavily rely on the kernel, and do evolve. So traditional way of tracking only app code behavior is not enough for the whole picture. For instance, if the pod is migrated from one k8s node to another k8s node, the iptables rule and route table need to be modified correspondingly, so if this works not correct, the calling may fail.
eBPF can be used to tracking kernel behavior, So we found it maybe helpful to track the kernel behavior and correlate all the information for each RPC call. And we named the each RPC call the “RPC trace”.
For the scenario mentioned before, with Kindling PRC trace, we hope we can answer following question for each rpc call:
- How many bytes has been send for the request? And how long it takes?
- During the request processing, for the user request, which file has been opened for write or read? And how long it takes?And how many bytes has been read or write.
- During the request processing, for the user request, if there are any outbound request been sent? how many bytes has been sent and how long it takes? how long it takes to get the response?
- How many bytes has been send as the response to the user? and how long it takes?
- If the process is waiting for a mutex singal during the request processing, how long it takes?
Basically, with Kindling RPC trace, we want to answer how kernel is working with the app code together to finish the user request.
For further reading, the following research paper metioned the theory:
- Precise, Scalable, and Online Request Tracing for Multi-tier Services of Black Boxes
- vPath: Precise Discovery of Request Processing Paths from Black-Box Observations of Thread and Network Activities
Distributed Tracing vs. RPC Trace
PRC trace is a part of distributed tracing for one of the specific rpc call. It can’t replace the APM tool, and it should work with APM tool by providing the detailed kernel behavior for infrastructure layer. If the request header has been populated with the Span information, the information can be used by Kindling to provide the link to the detailed APM dashboard which is used for app code perspective. But if you don’t trust any auto instrument mechanism or you cannot afford the cost of instrumentation manually, and your product environment is not as complicated as the big giant company. You can just use the servicemap and rpc trace from Kindling to identify the direction for further digging.