安装配置Grafana
Since the grafana plugin has not yet passed the plugin market review, we temporarily provide a pre-installed container image of kindling plugin and dashboard.
1. Install Grafana in the namespace of kindling
kubectl create -f https://k8s-bpf-probes-public.oss-cn-hangzhou.aliyuncs.com/kindling-grafana.yaml -n kindling
2. Find the address of the Grafana and visit the page
kubectl get svc -n kindling | grep grafana
3. Add a data source of Prometheus
Configure the installed Prometheus address in the cluster. The data source name must be Prometheus.
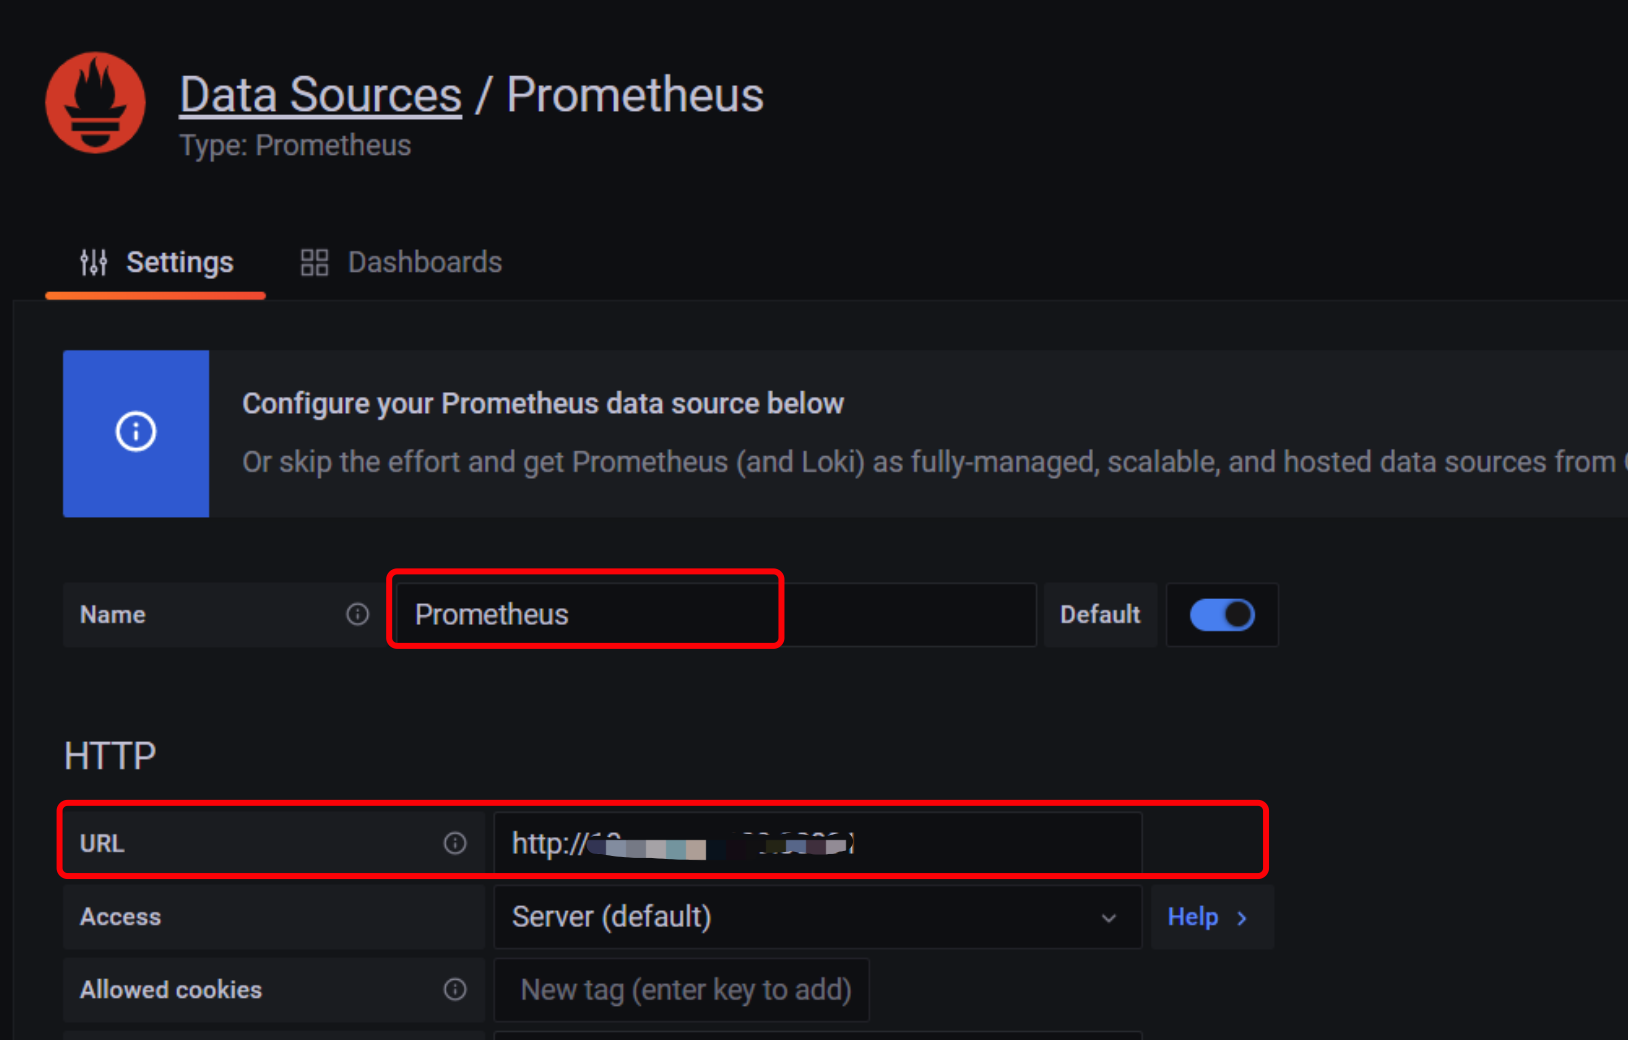
See more detail for how to add a data source .
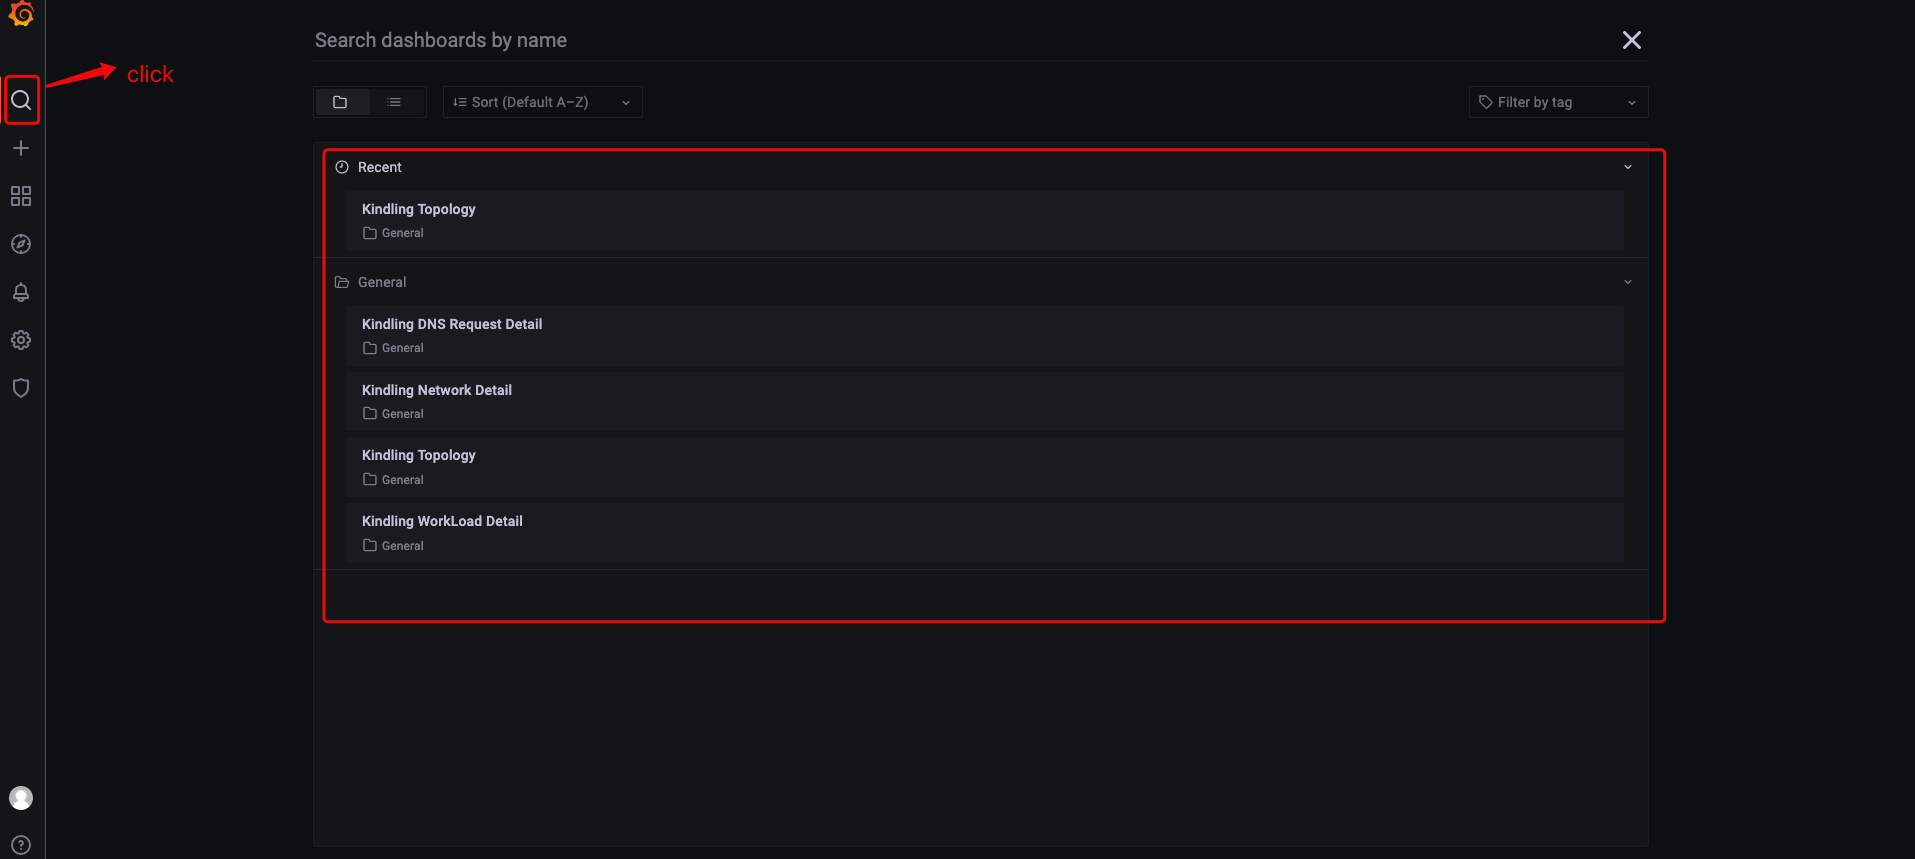
4. Verify
Click Search dashboard, you should be able to see the dashboards.
For more information, please visit the grafana installation documentation .