Kindling

eBPF-based Cloud Native Monitoring tool

Understanding the app behavior from kernel to app code

Get Started Watch the Demo
Why Choose Kindling
01
Trace Profiling Read more
  • How all threads were executed is recorded and can be replayed.
  • The exact thread which executed the trace span is highlighted.
  • The logs printed by each thread are collected and correlated to the relative thread with its timestamp.
  • The code execution flame graph is correlated to the time series where CPU is busy.
  • The network-related metrics are correlated to the time series where the network syscalls are executing.
  • The file-related metrics are correlated to the time series where the file syscalls are executing.
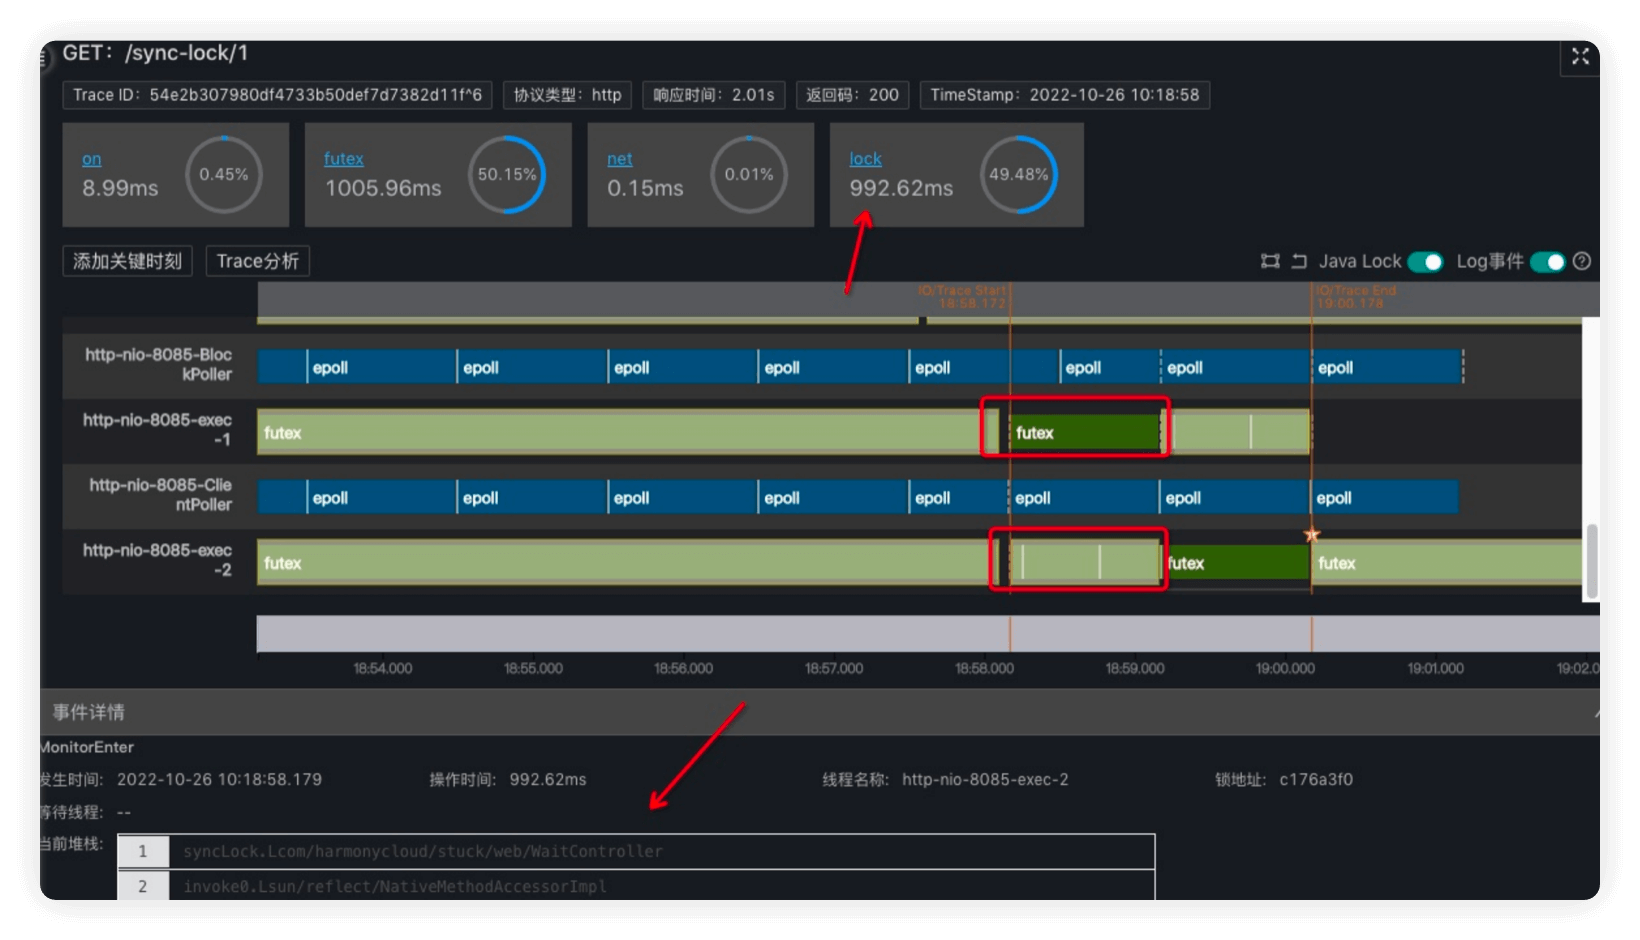
An example about "Pessimistic Lock": the thread task-2 spends most of its time to wait thread task-1. And also you can see the stack info. Read more
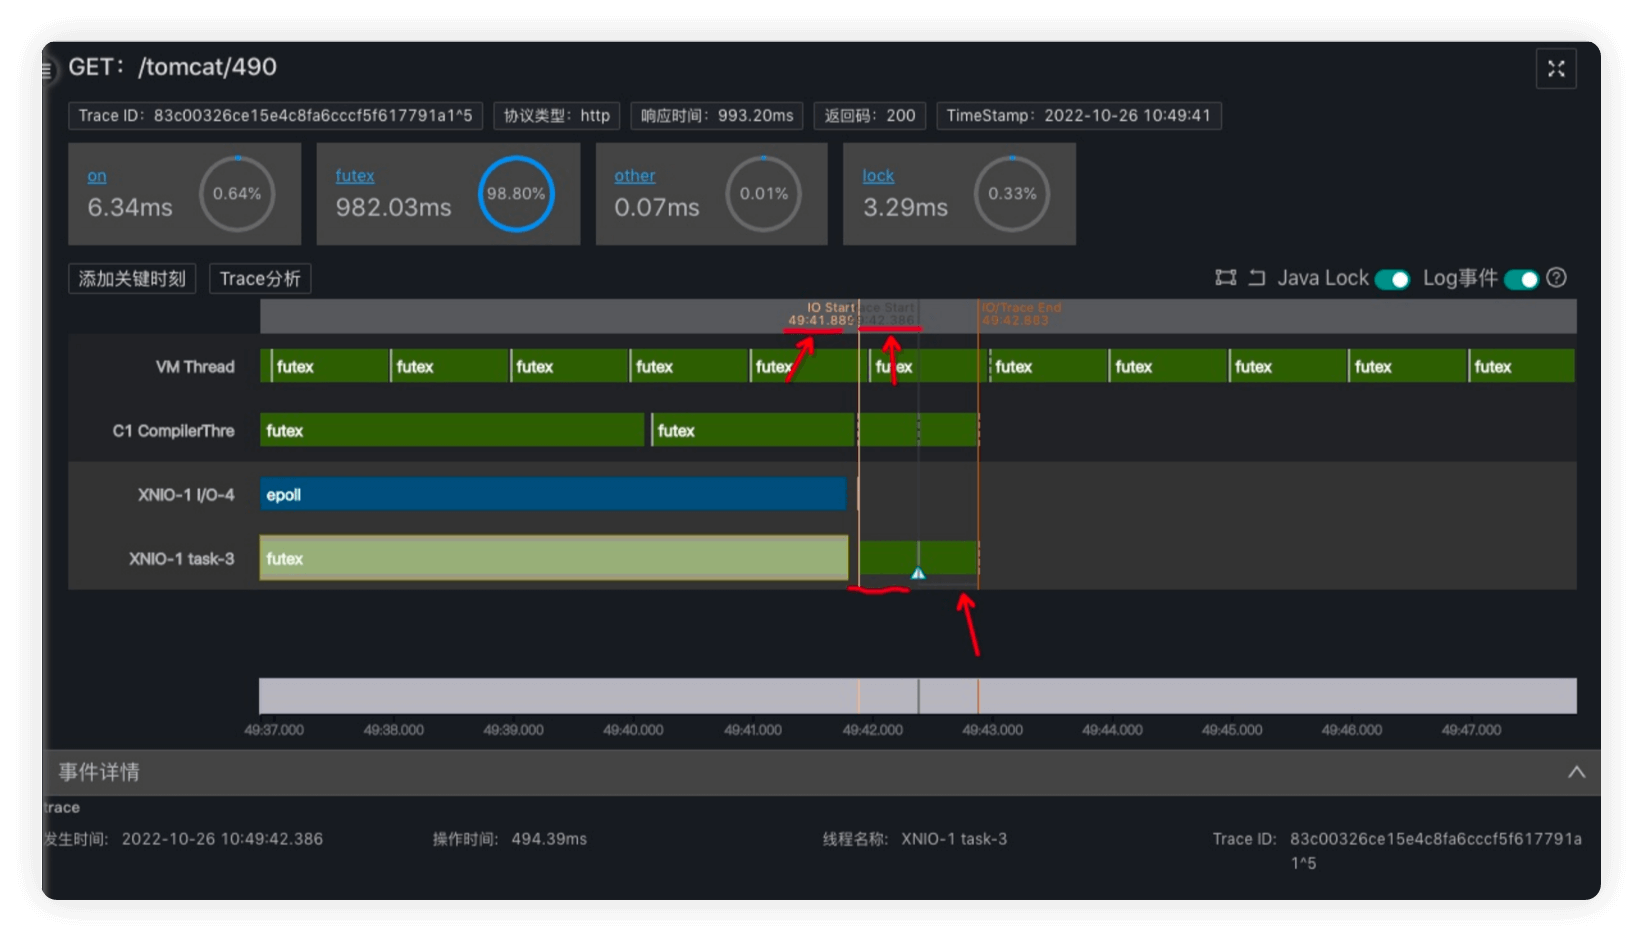
An example about "Thread Starvation": the request waited for some time after the IO started before it was actually executed, indicating that the thread resources were insufficient. Read more
02
RootCause Triage
With RPC trace,the user can identify the root-cause direction quickly, like if the issue is caused by network issue, code issue, storage issue, mutex Lock issue, the out-banding call issue. The first version can only identify request sending issue, code issue, downloading issue. The other issue identification is under active developing, will coming soon.
03
Network Flow Visualization
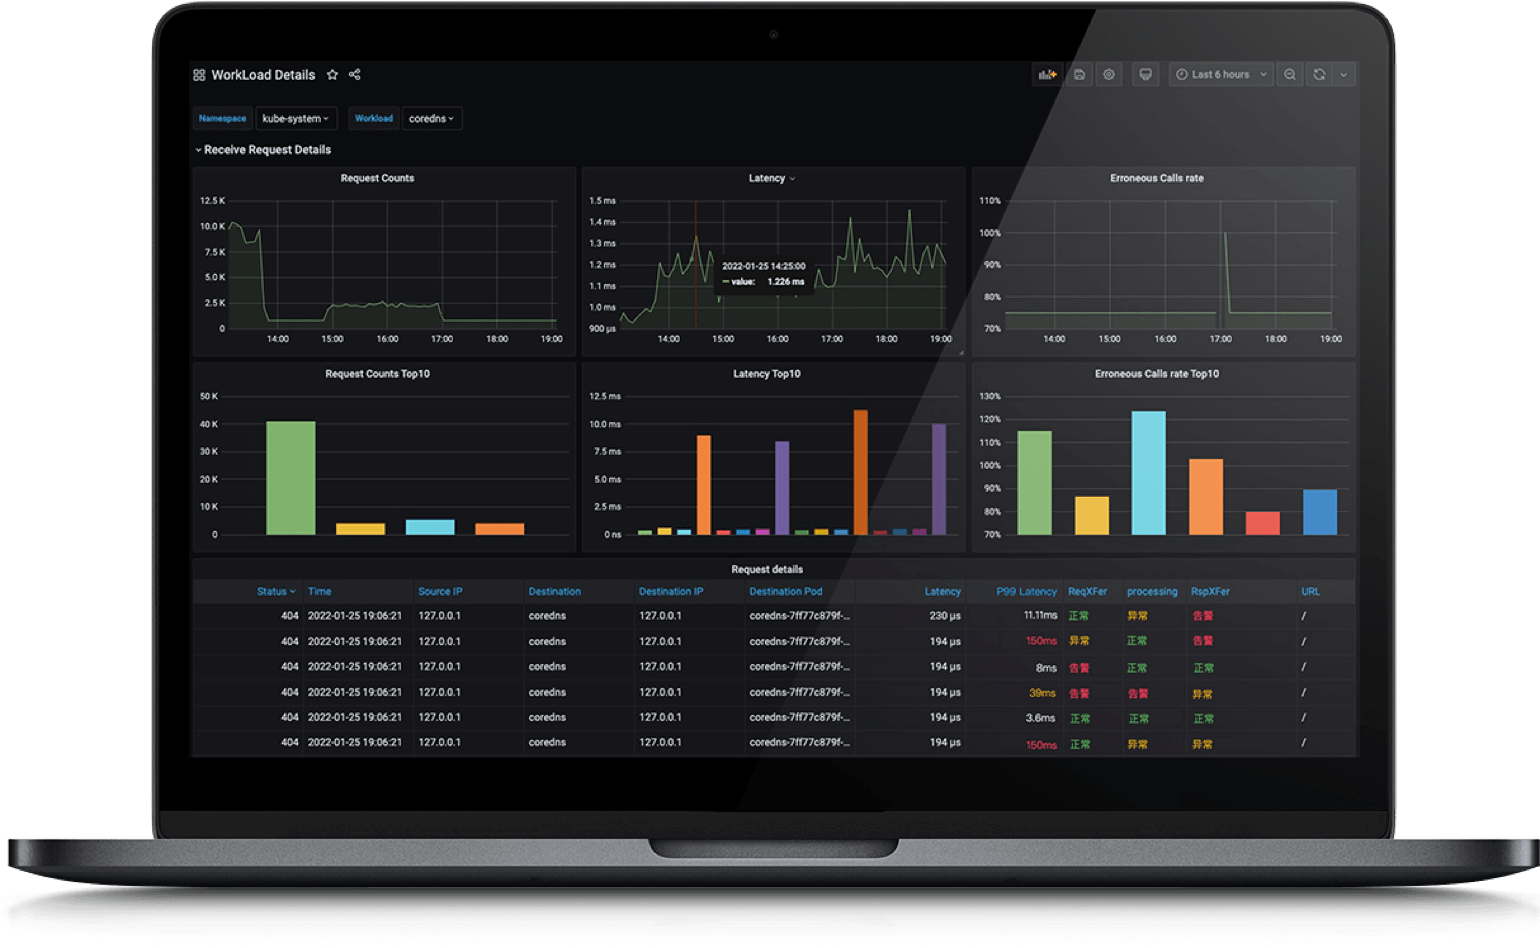
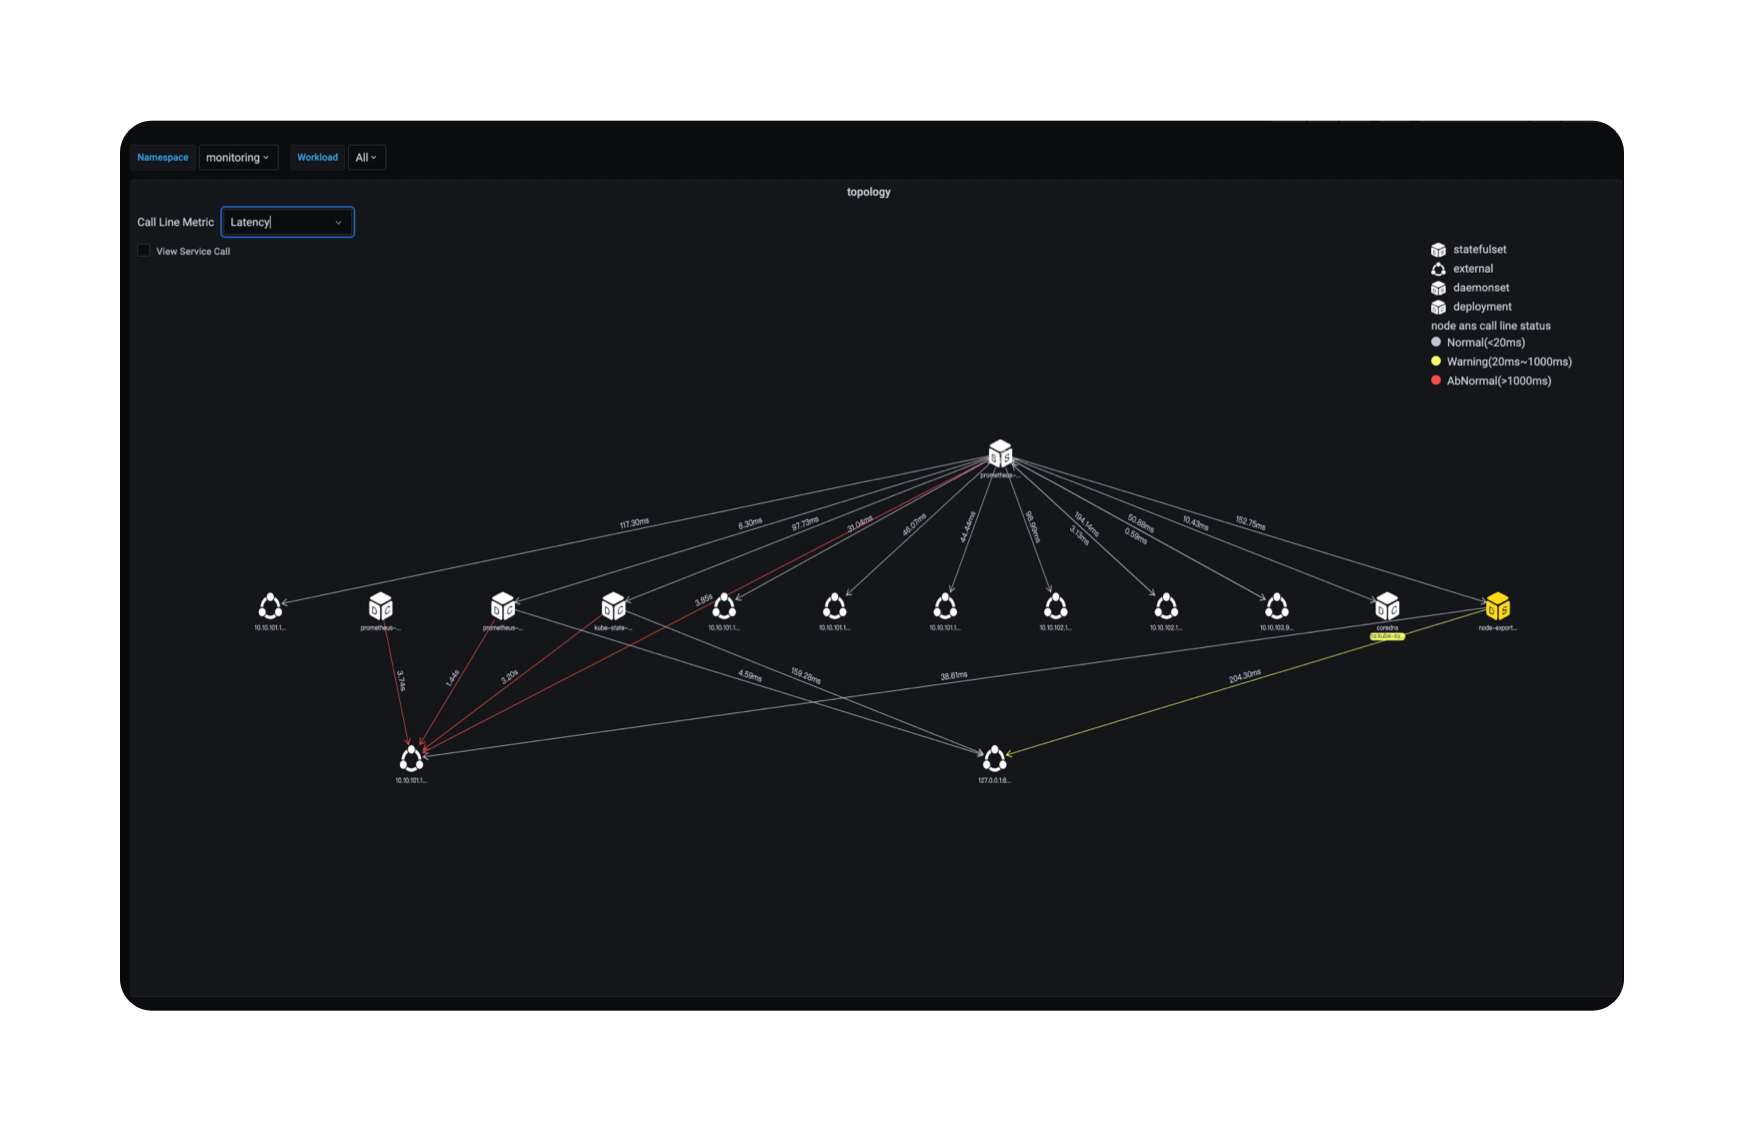
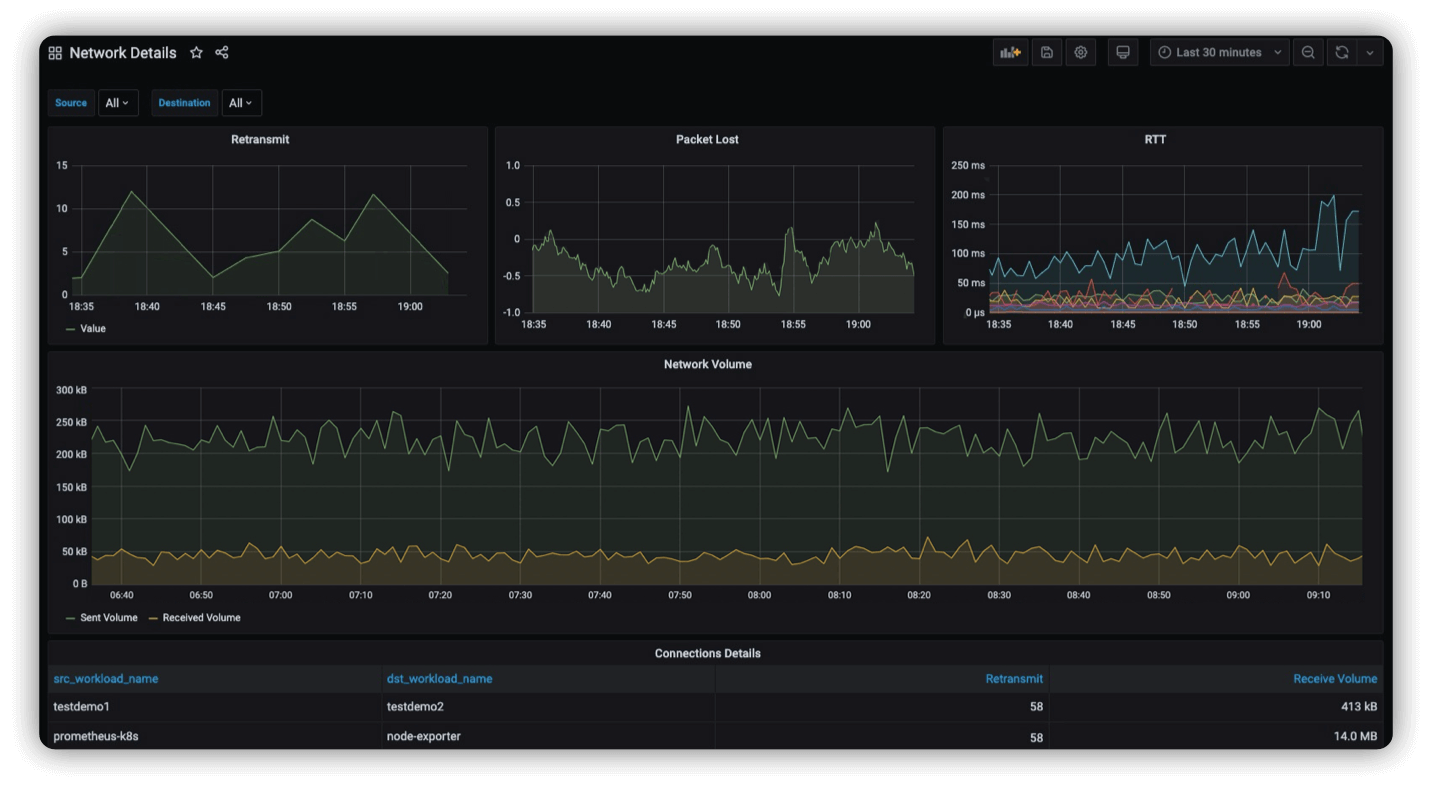
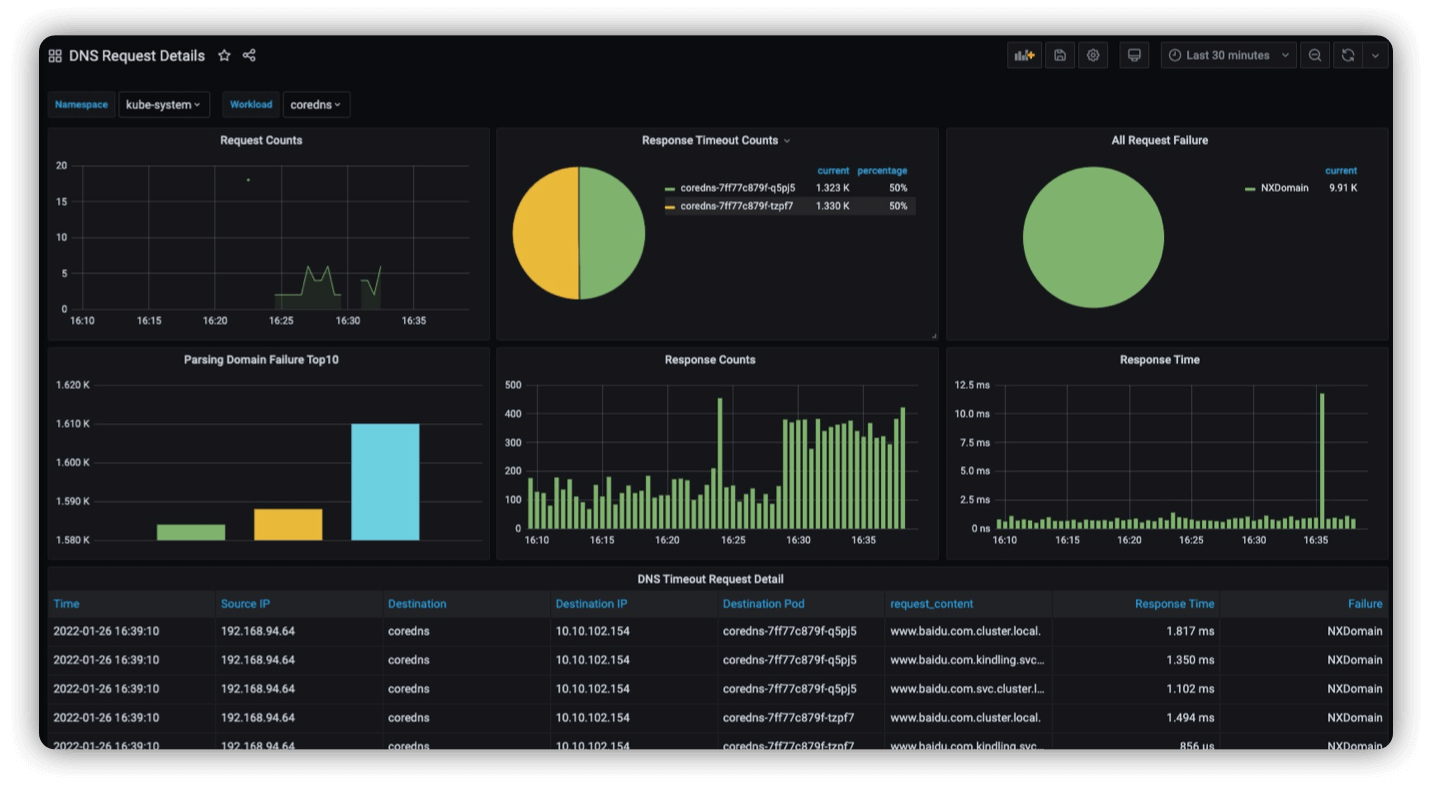
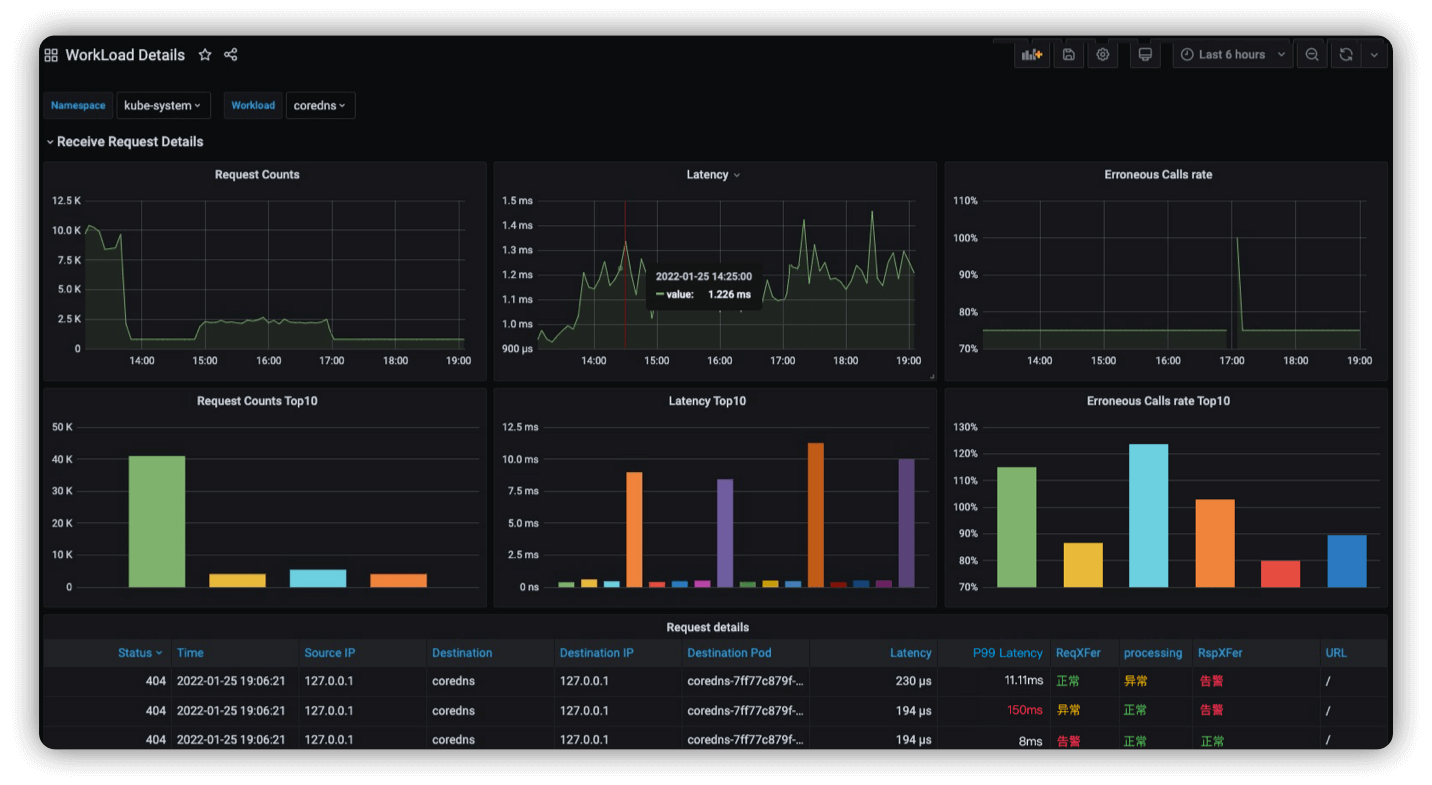
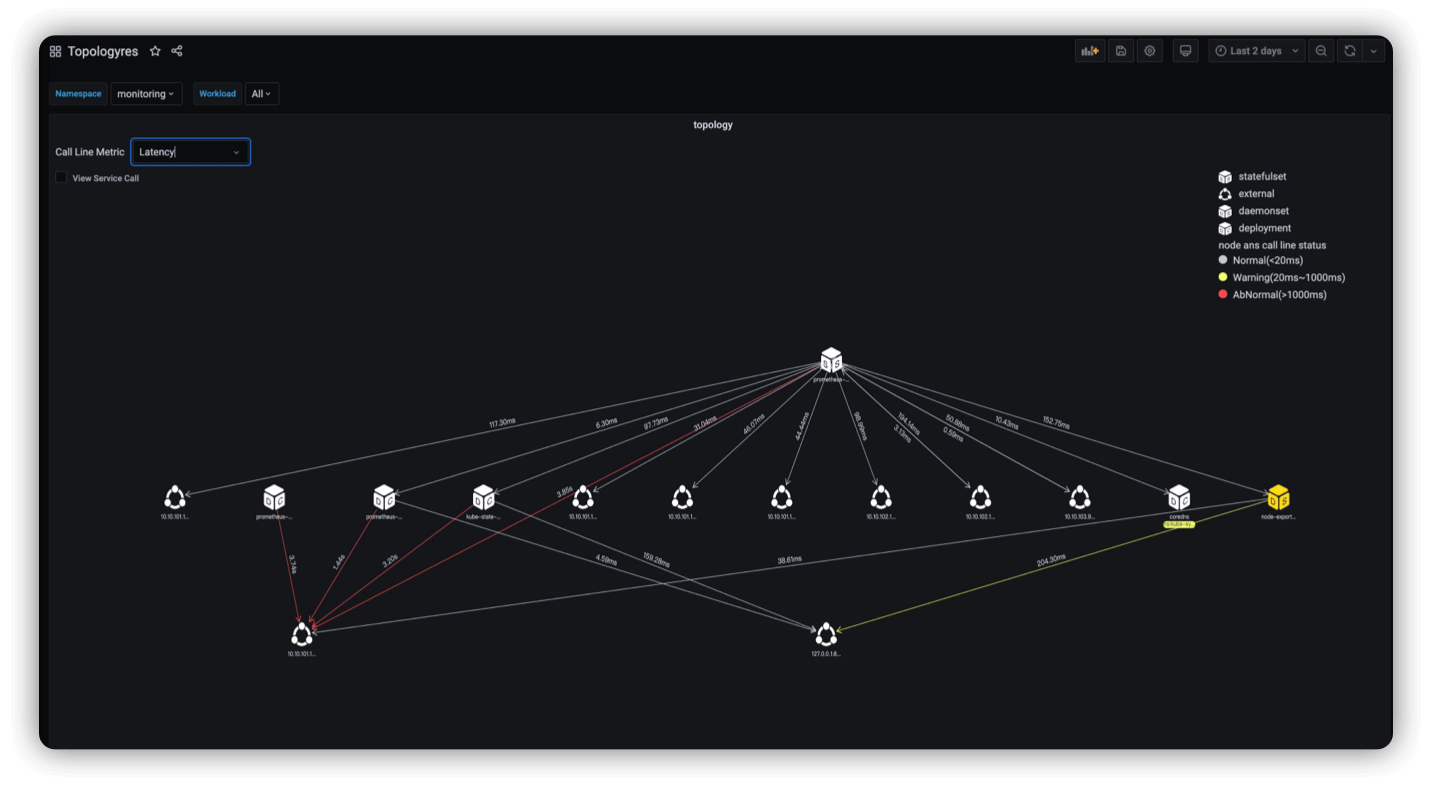
The service map can be viewed and many network metric can be monitored like,re-transmit,DNS,round-trip time. And golden metric like traffic,latency, error rate can be also viewed.
04
Prometheus Integration For Full Stack Monitoring
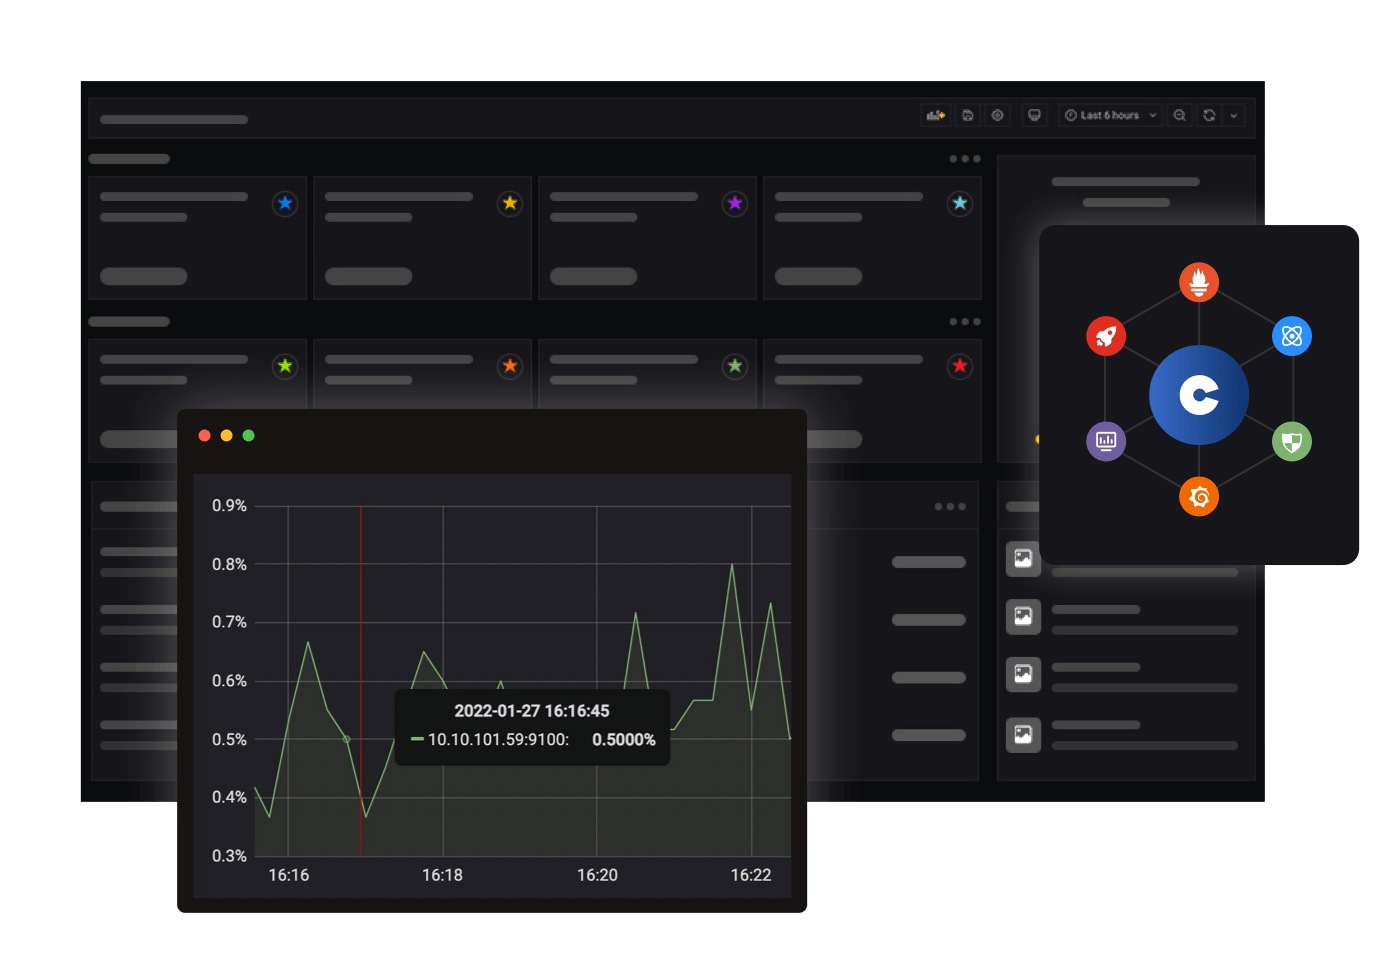
cAdvisor/MetricServer/Node Exporter/NPD, and Prometheus has been integrated and enriched with Kindling metric for full stack monitoring. The pod and node status metric can be viewed when the user found the response time is slow, and all the data are correlated. Standard version has this feature.
05
Open Source
Kindling will be open-sourced with two version. One is light version can be integrated into Prometheus server and metric can be viewed with Grafana plugin. Another version is the standard version, which has much detailed information and integrated with Prometheus for full stack monitoring.
Who Choose Kindling

公众号

微信